YieldSAT: A Multimodal Benchmark Dataset for High-Resolution Crop Yield Prediction

RPTU Kaiserslautern-Landau, DFKI GmbH, Vision Impulse GmbH, University of Groningen
CVPR 2026

Dataset access, notebook, and tutorial are available now. Paper and arXiv links will be added after publication.

Dataset Formats

YieldSAT is available in two formats to accommodate different research needs and model architectures:

Preprocessed Format (ML-Ready)

  • Format: Xarray dataset
  • Time Steps: 24 uniformly sampled time steps
  • Fusion Strategy: Input fusion via concatenation and spatial/temporal repetition
  • Use Case: Rapid prototyping, baseline models, quick experimentation, and fast training
  • Advantages: Ready for immediate training, standardized format

Flexible Format

  • Format: Individual files per modality with metadata
  • Modalities: Separate files for Sentinel-2, weather, soil, topography, yield
  • Use Case: Advanced fusion methods, custom preprocessing, novel architectures
  • Advantages: Full flexibility, preserve original temporal, spatial, and spectral resolution
Dataset Overview

YieldSAT is the first multimodal dataset for crop yield prediction at both field and subfield (pixel) levels, combining combine harvester yield data, Sentinel-2 time series, weather, soil, and topography information across 4 countries, 4 crop types, and 9 years (2016-2024).

Abstract

Crop yield prediction requires substantial data to train scalable models. However, creating yield prediction datasets is constrained by high acquisition costs, heterogeneous data quality, and data privacy regulations. Consequently, existing datasets are scarce, low in quality, or limited to regional levels or single crop types, 
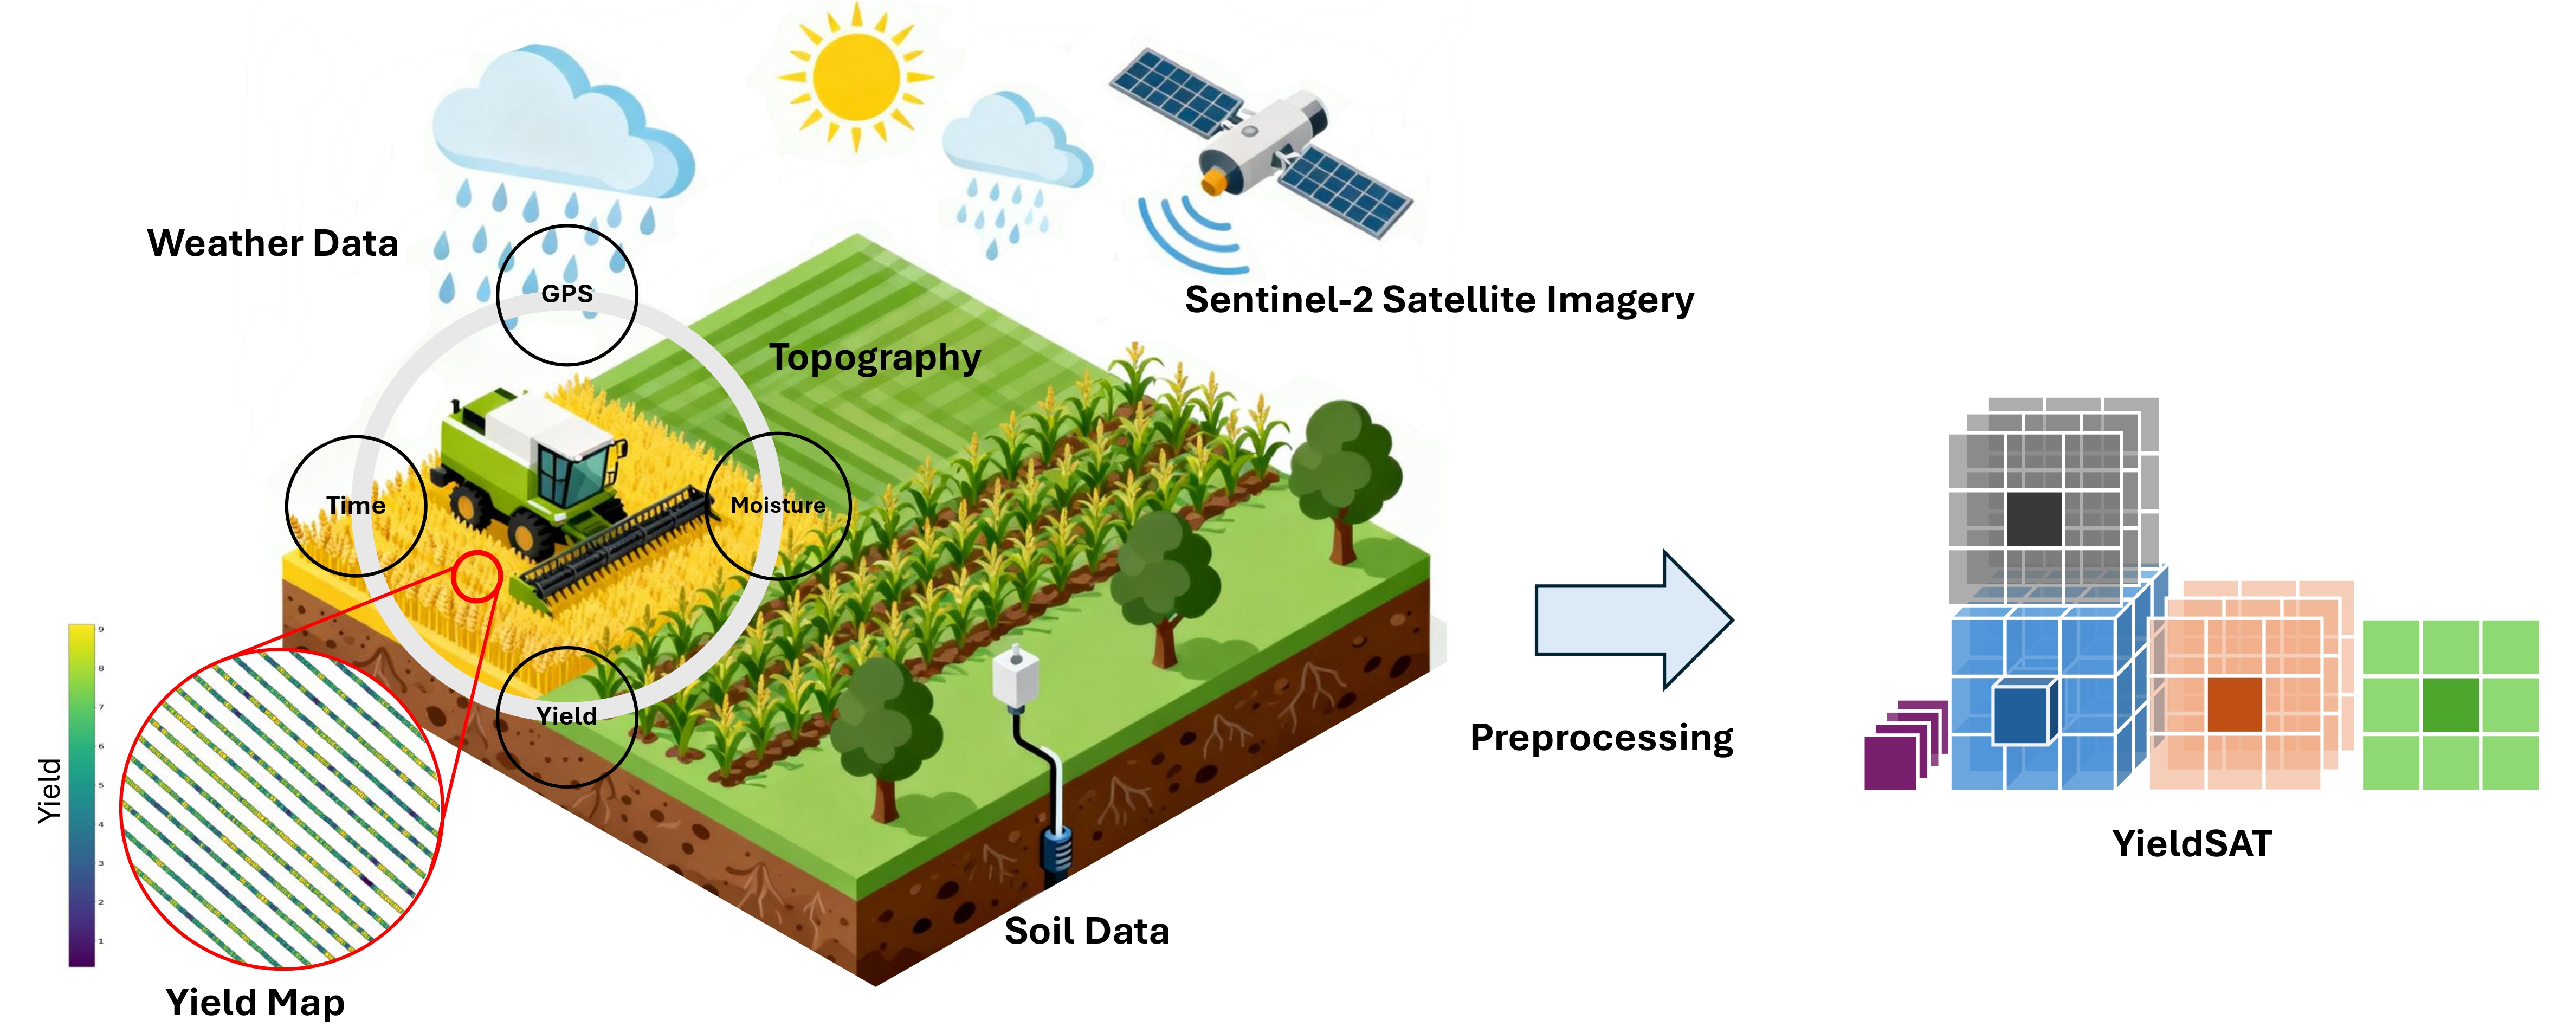
hindering the development of scalable data-driven solutions. In this work, we release YieldSAT, a large, high-quality, and multimodal dataset for high-resolution crop yield prediction. YieldSAT 
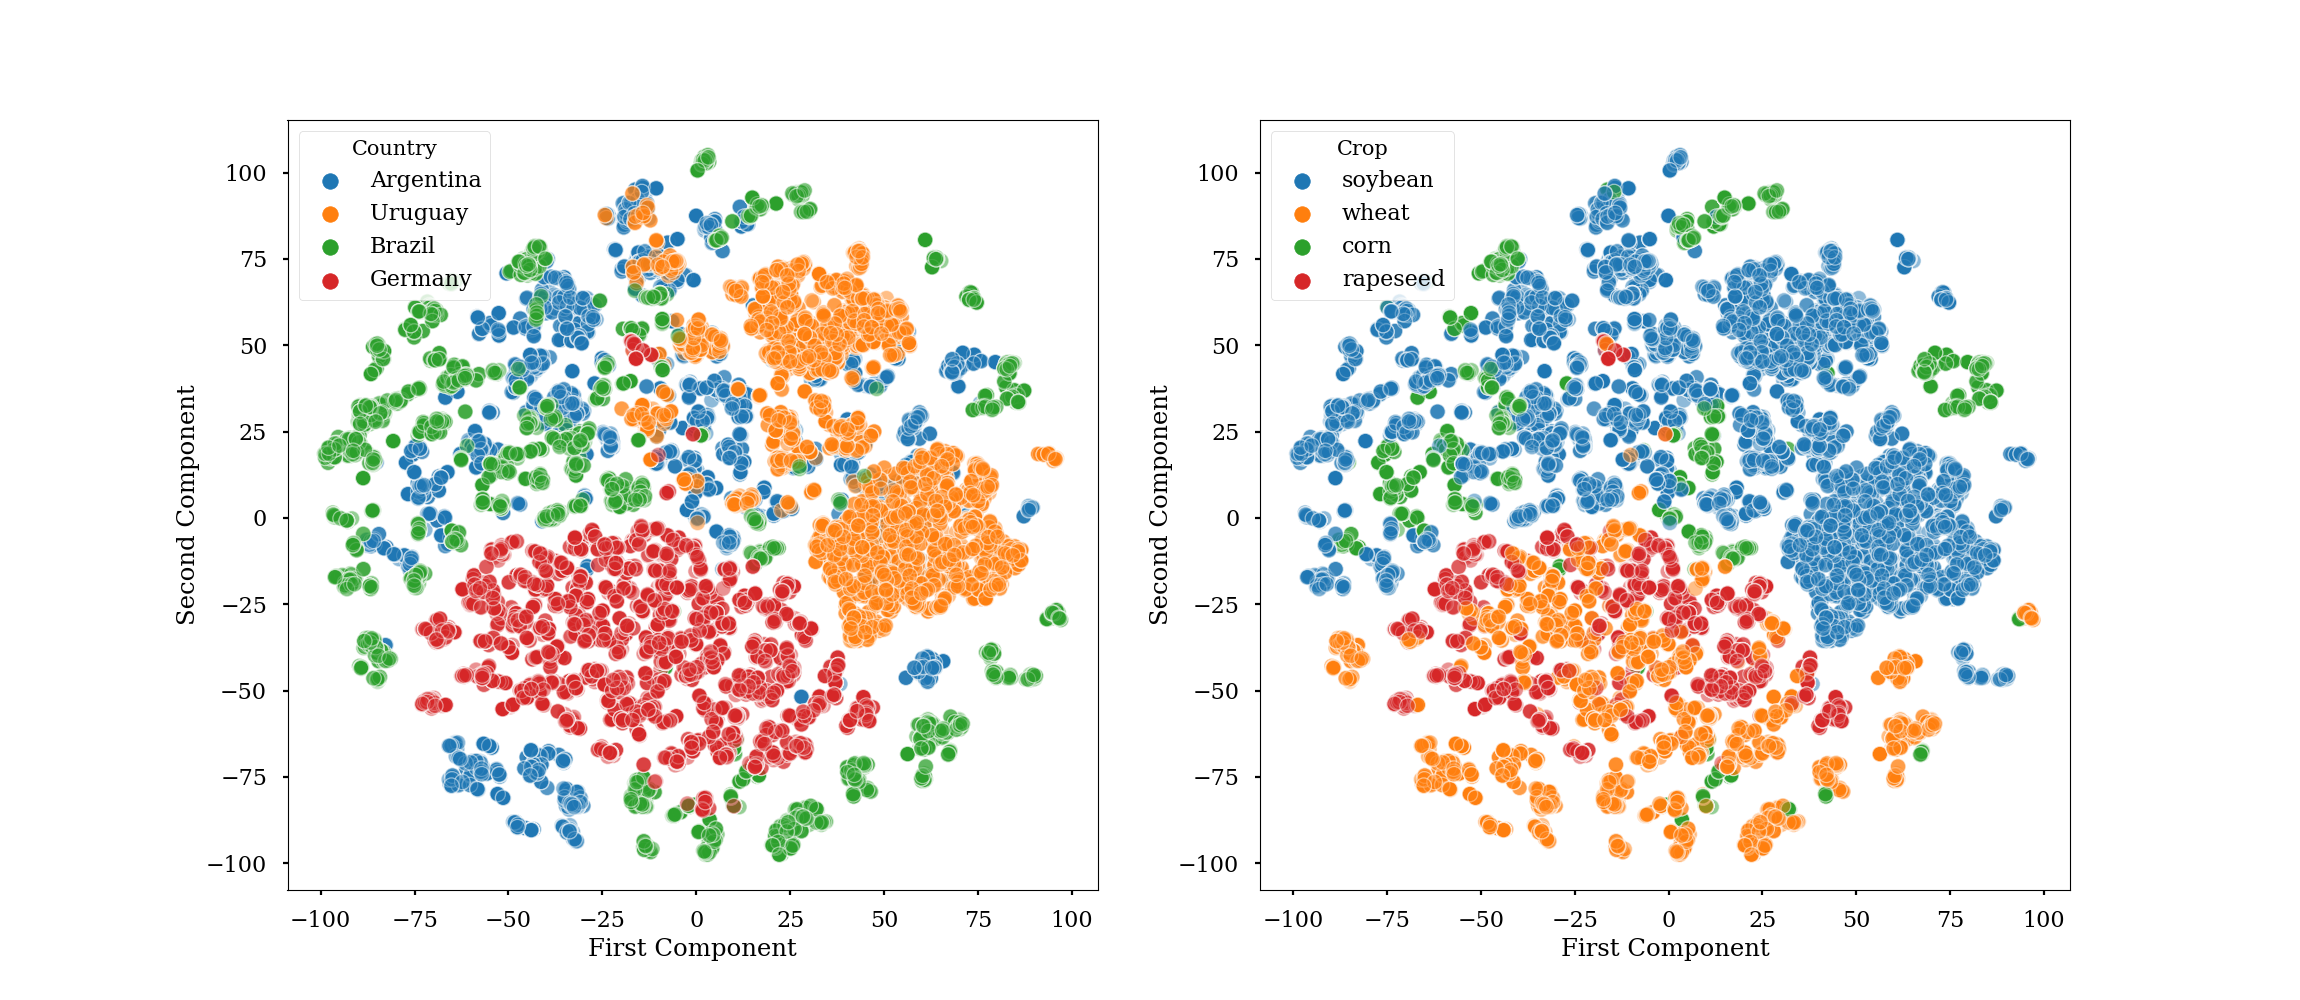
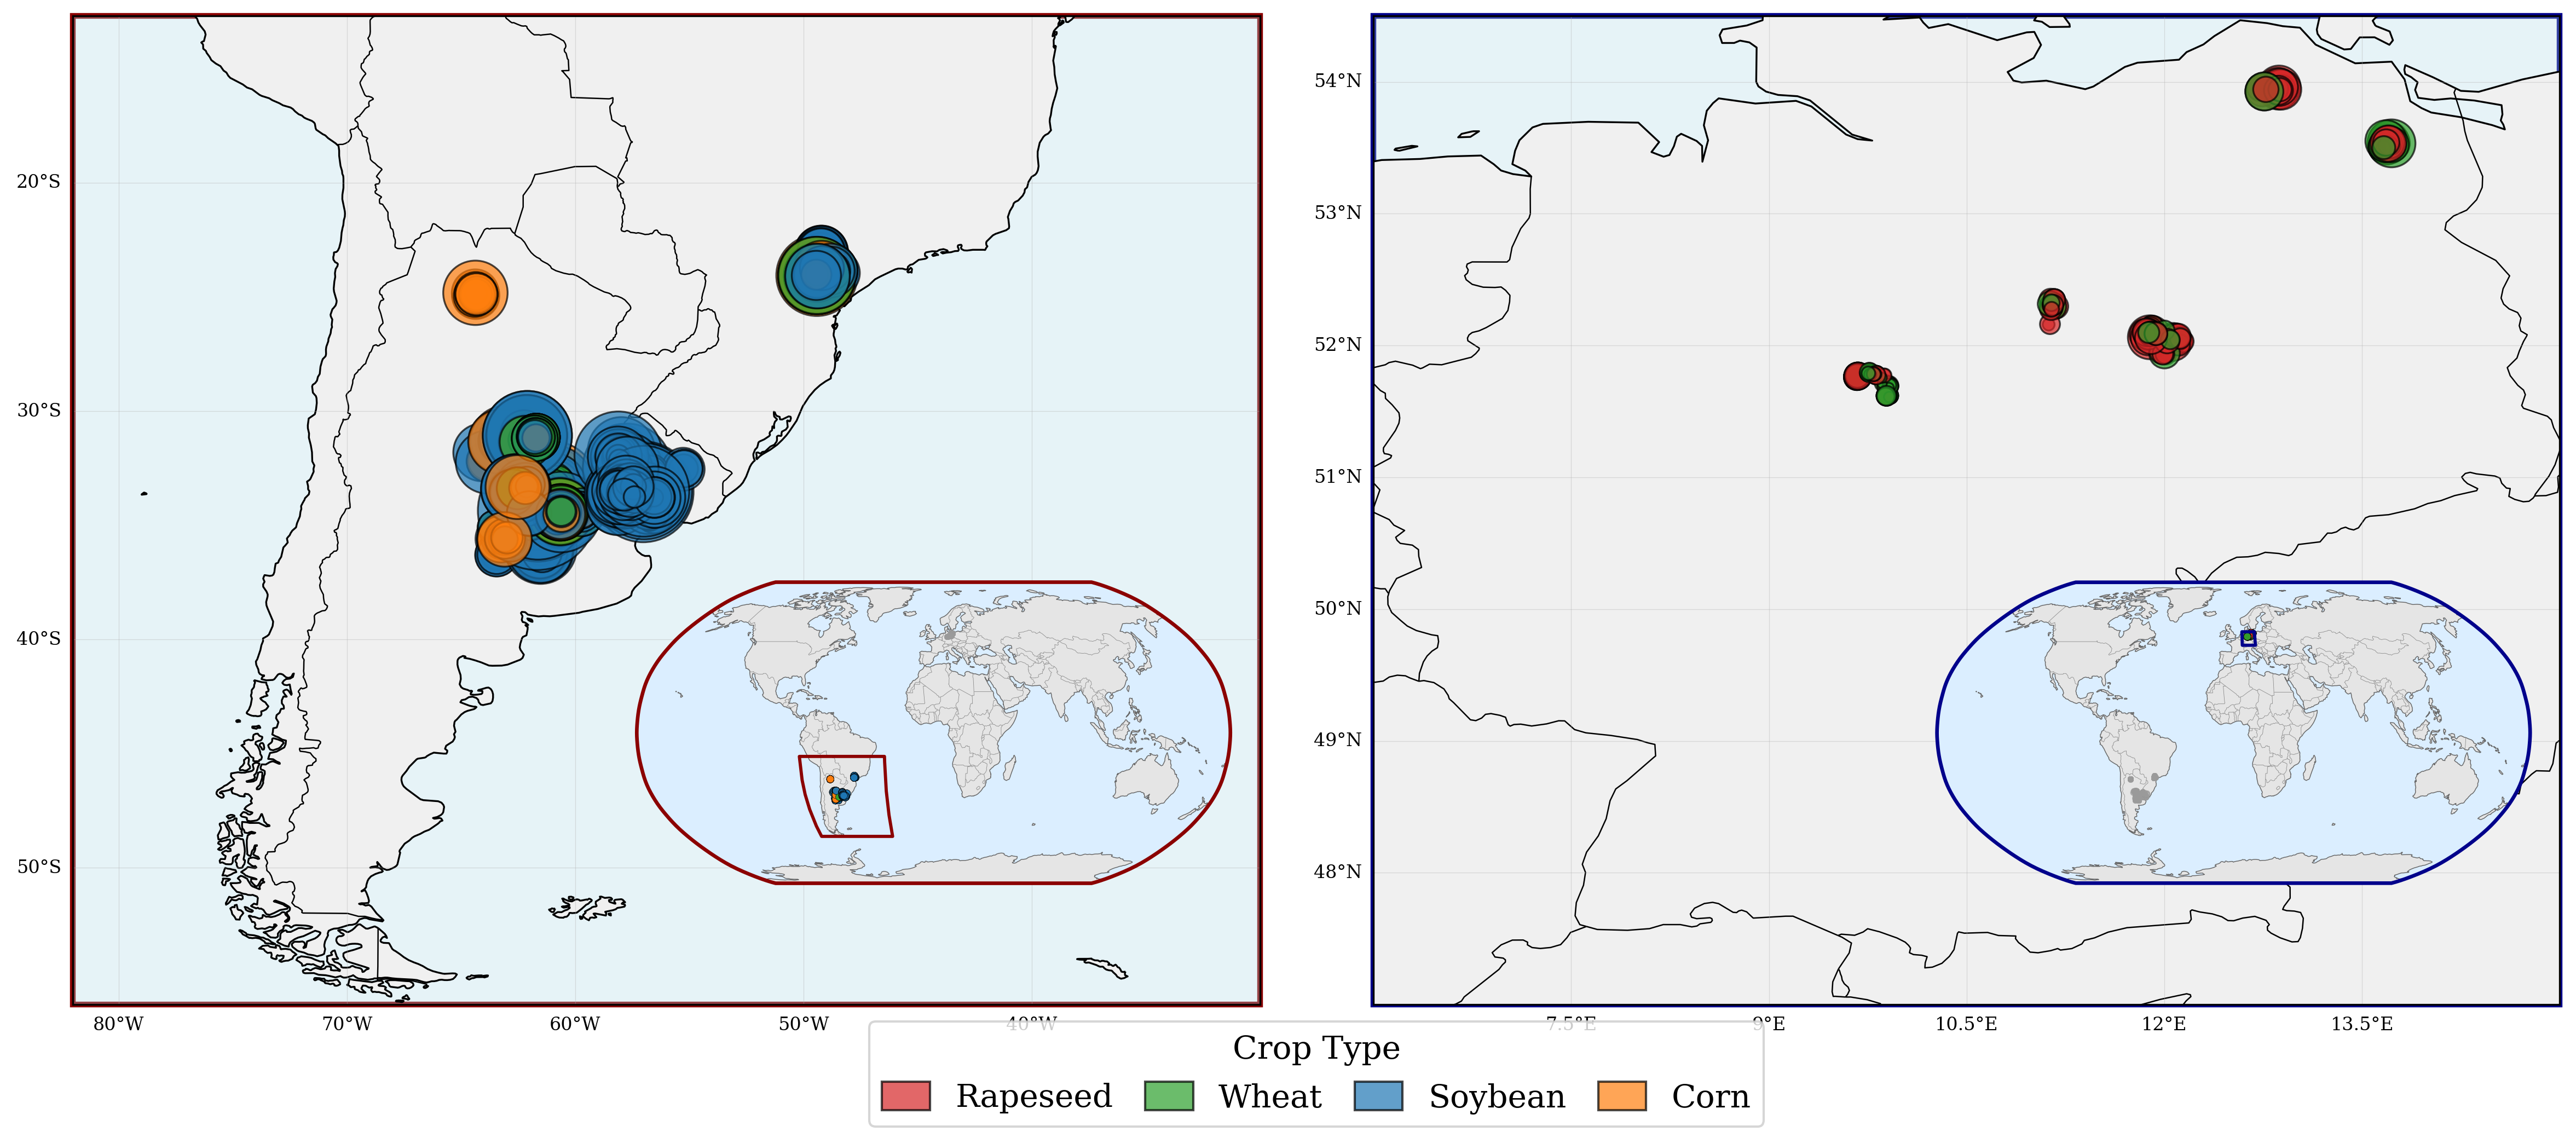
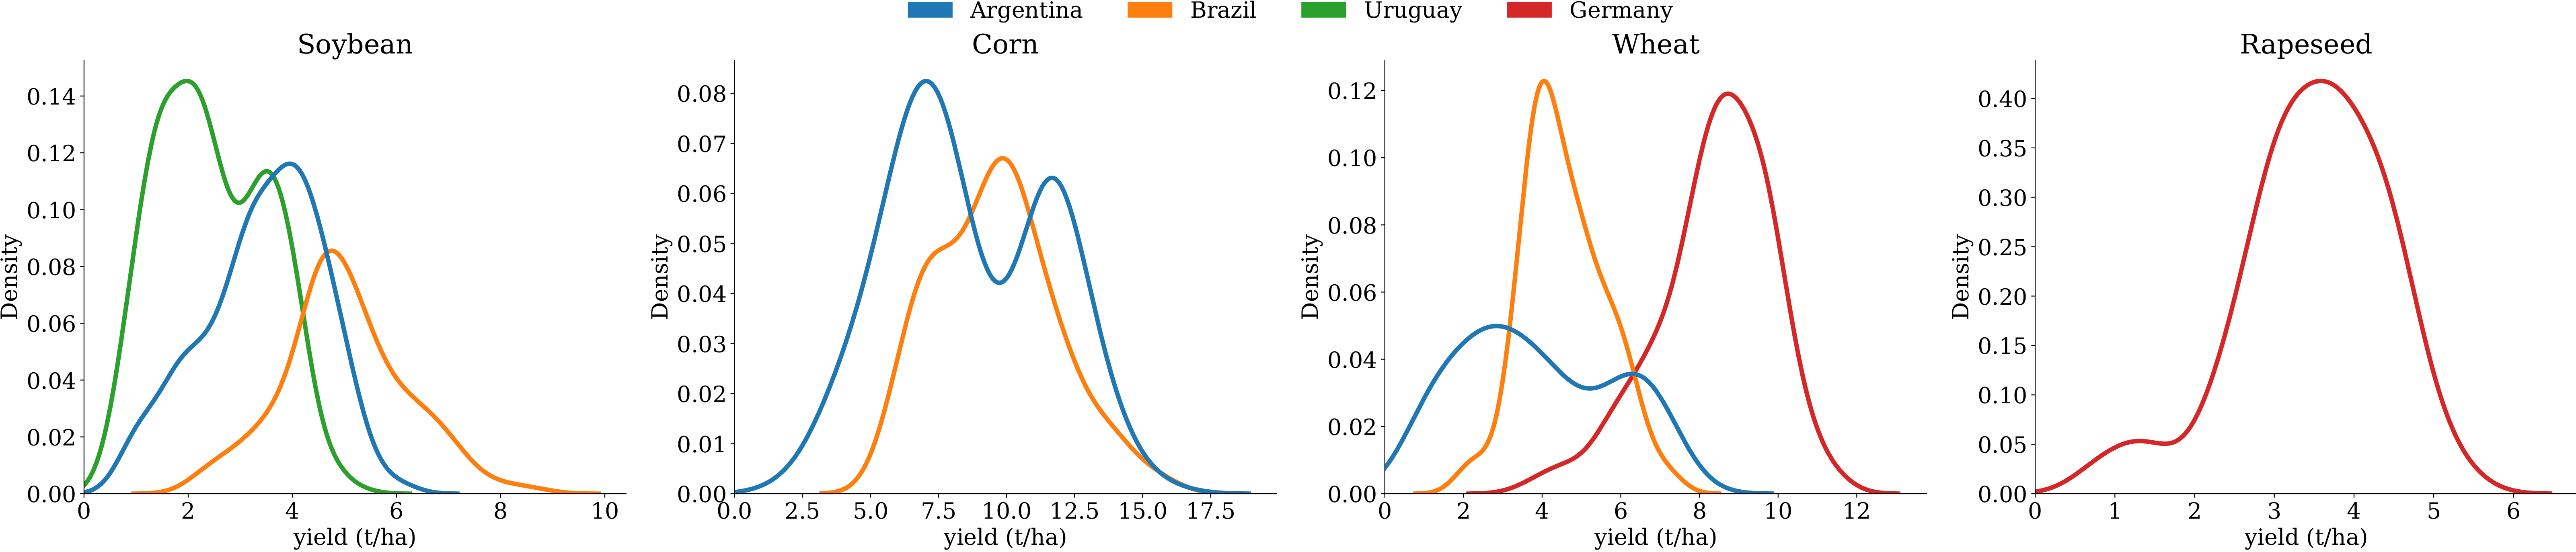
spans various climate zones across multiple countries, including Argentina, Brazil, Uruguay, and Germany, and includes major crop types, including corn, rapeseed, soybeans, and wheat, across 2,173 expert-curated fields. 
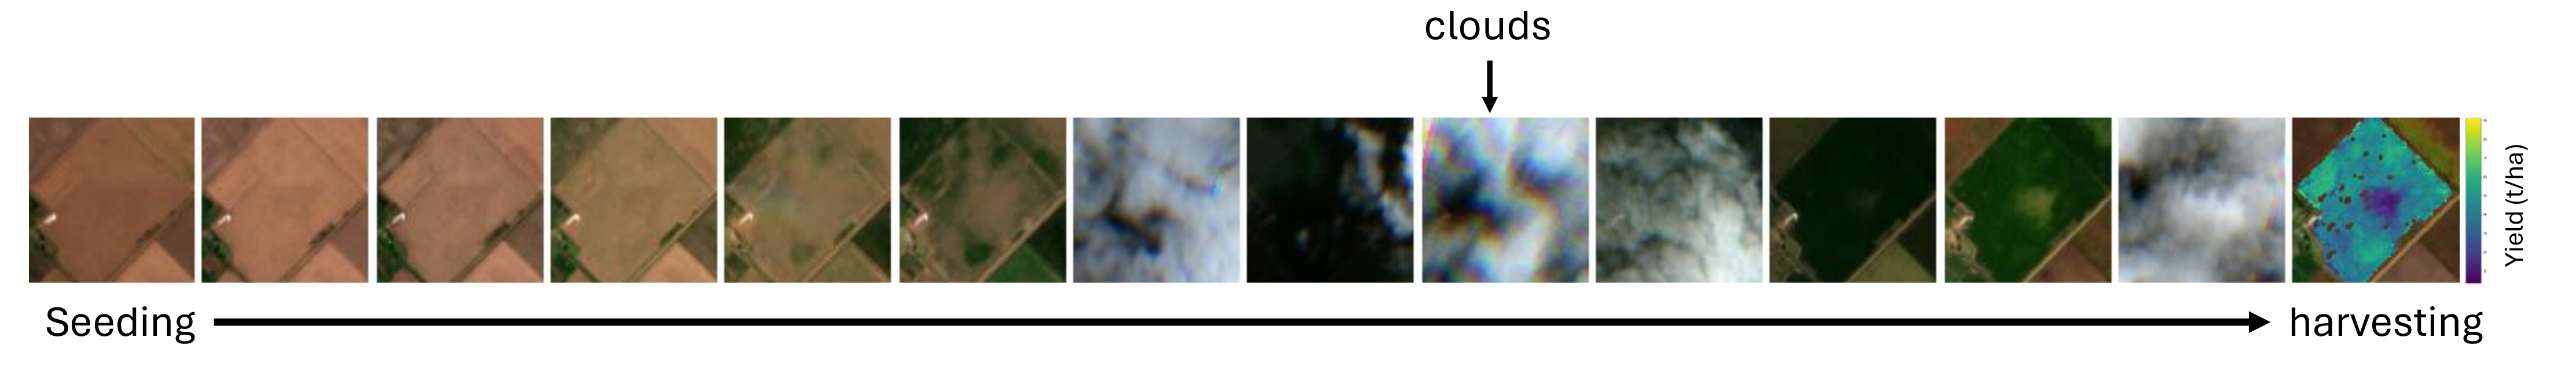
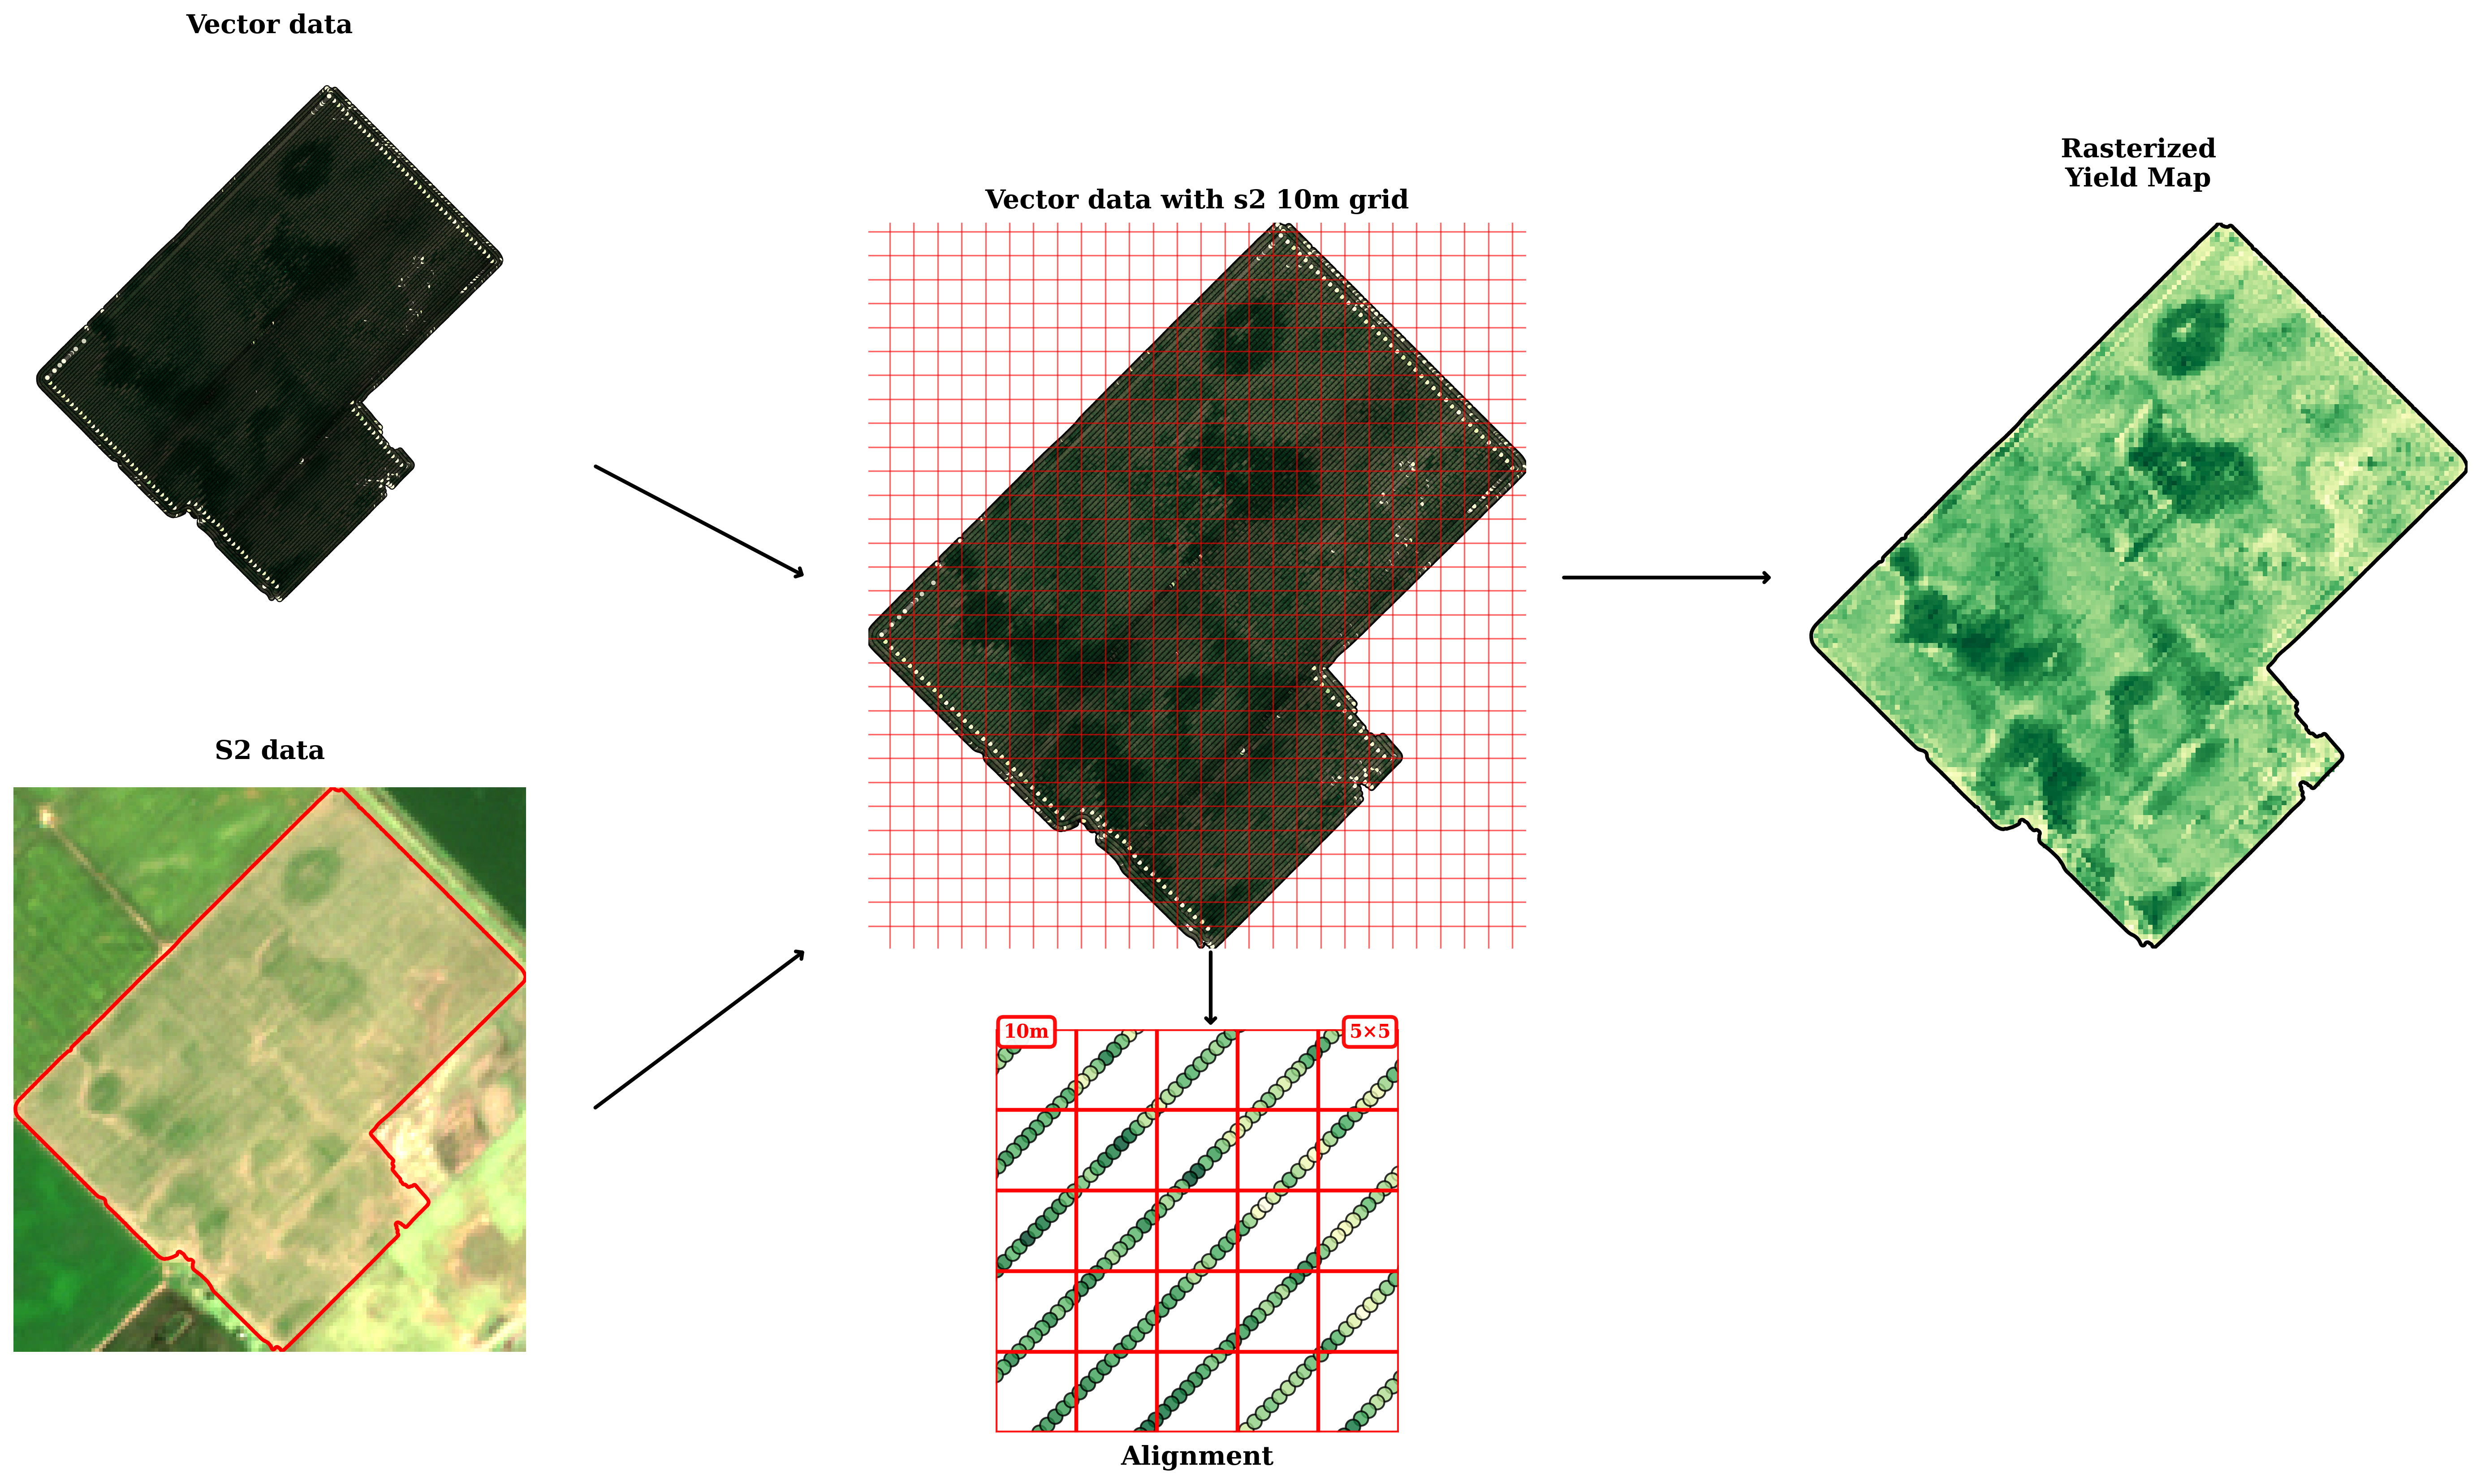
In total, over 12.2 million yield samples are available, each with a spatial resolution of 10 m. Each field is paired with multispectral satellite imagery, resulting in 113,555 labeled satellite images, 
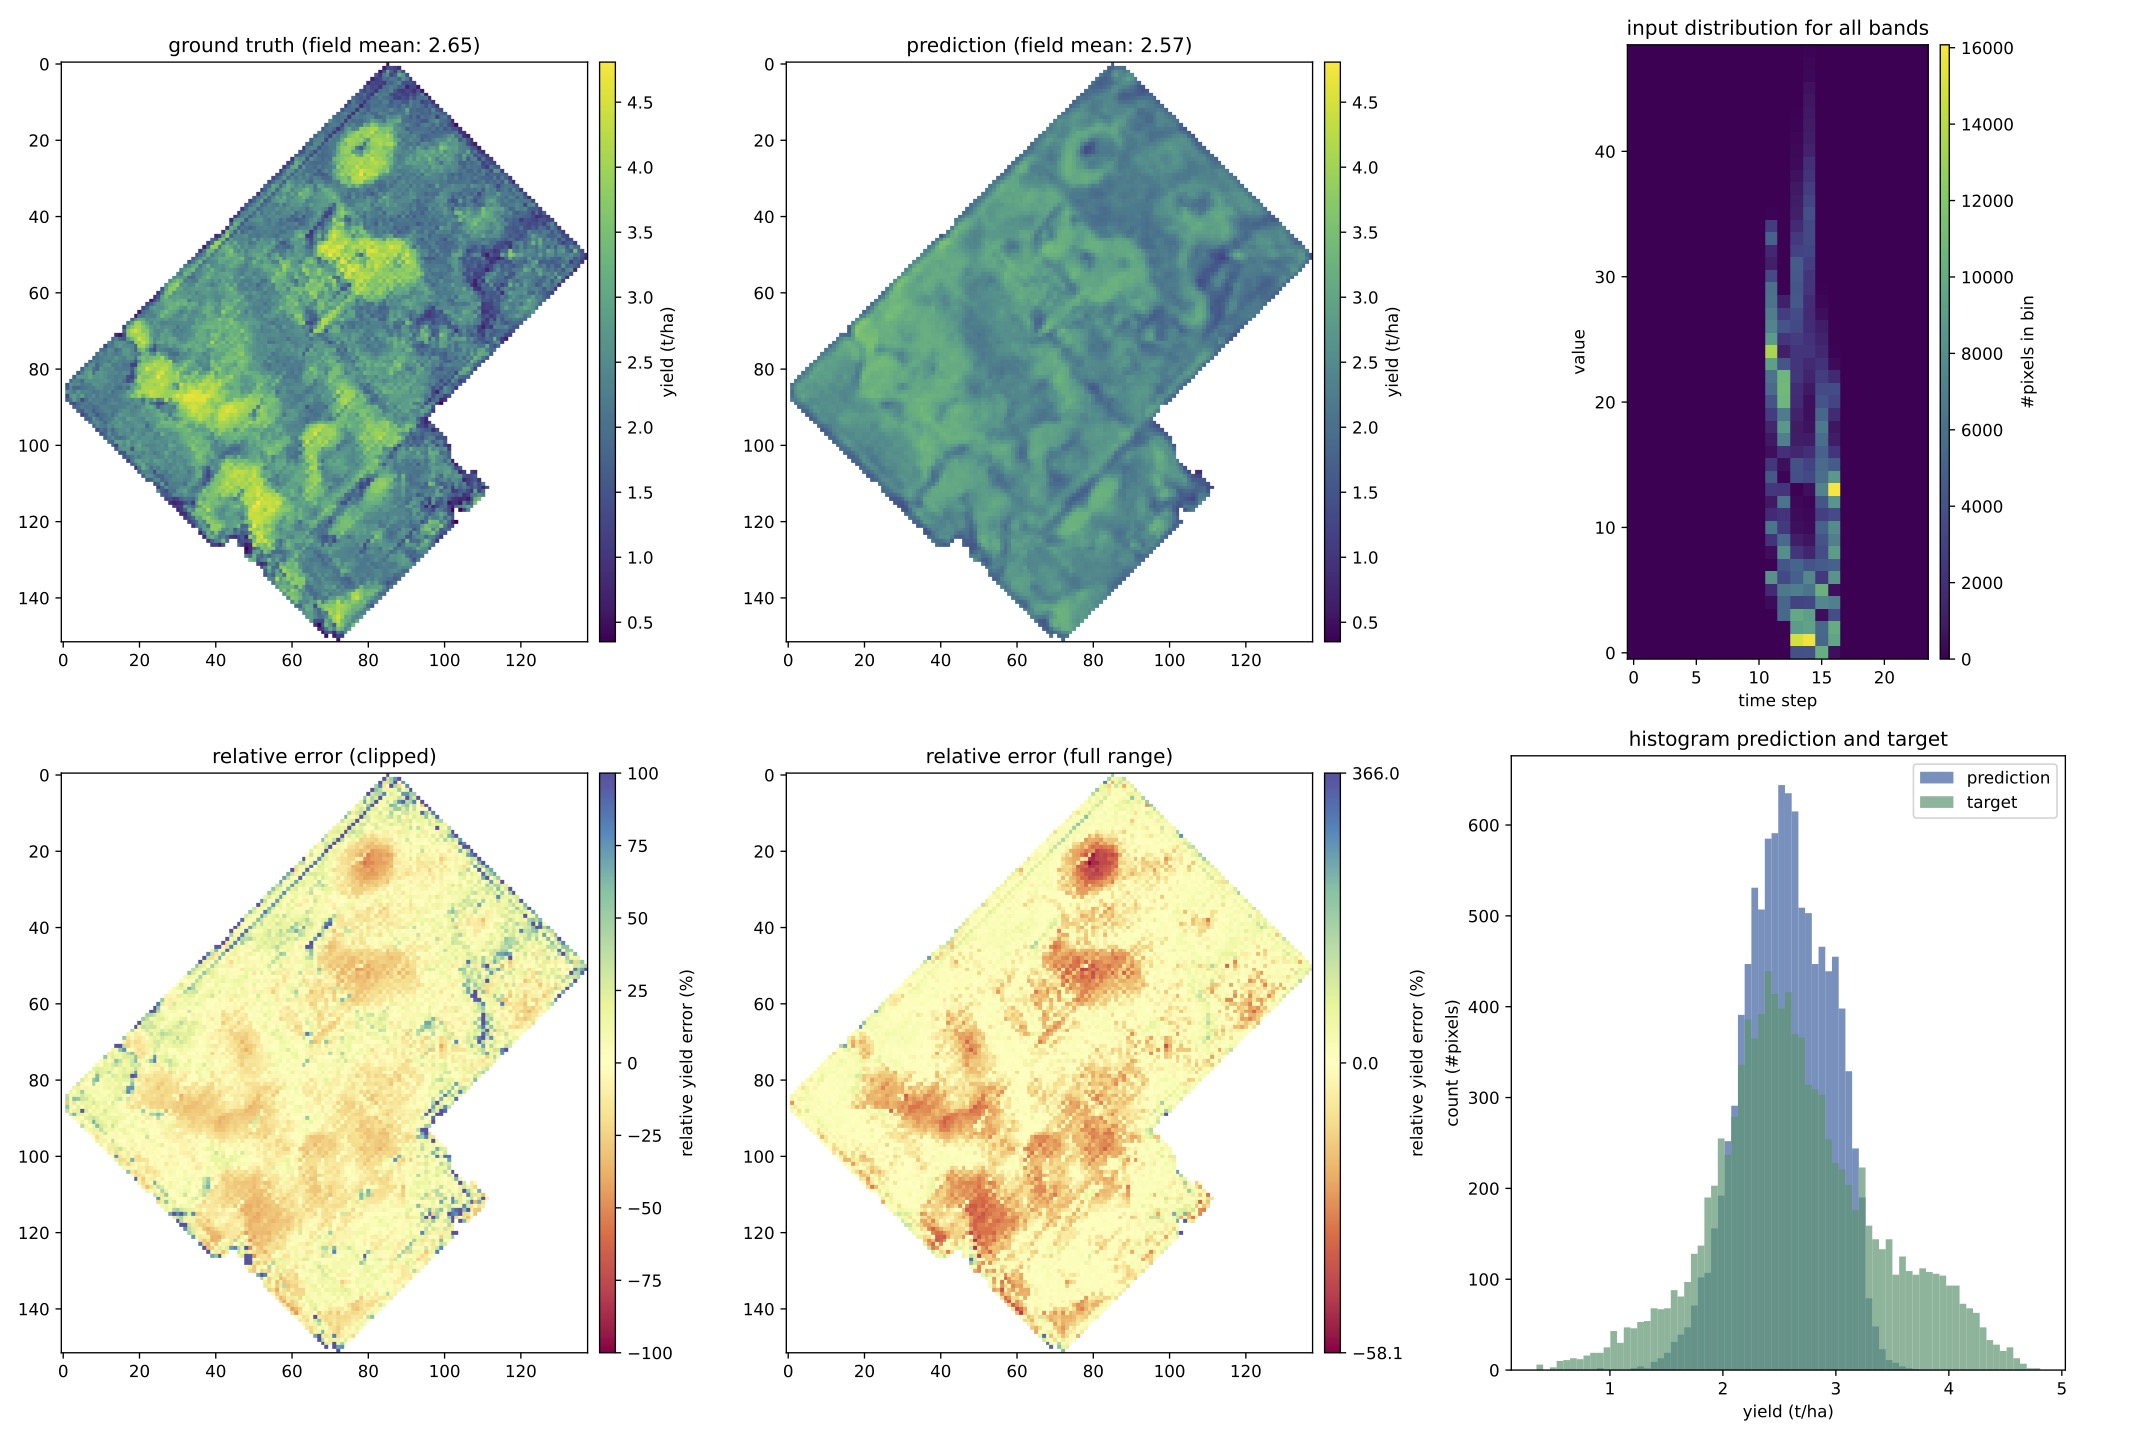
complemented by auxiliary environmental data. We demonstrate the potential of large-scale and high-resolution crop yield prediction as a pixel regression task by comparing various deep learning models and data fusion 
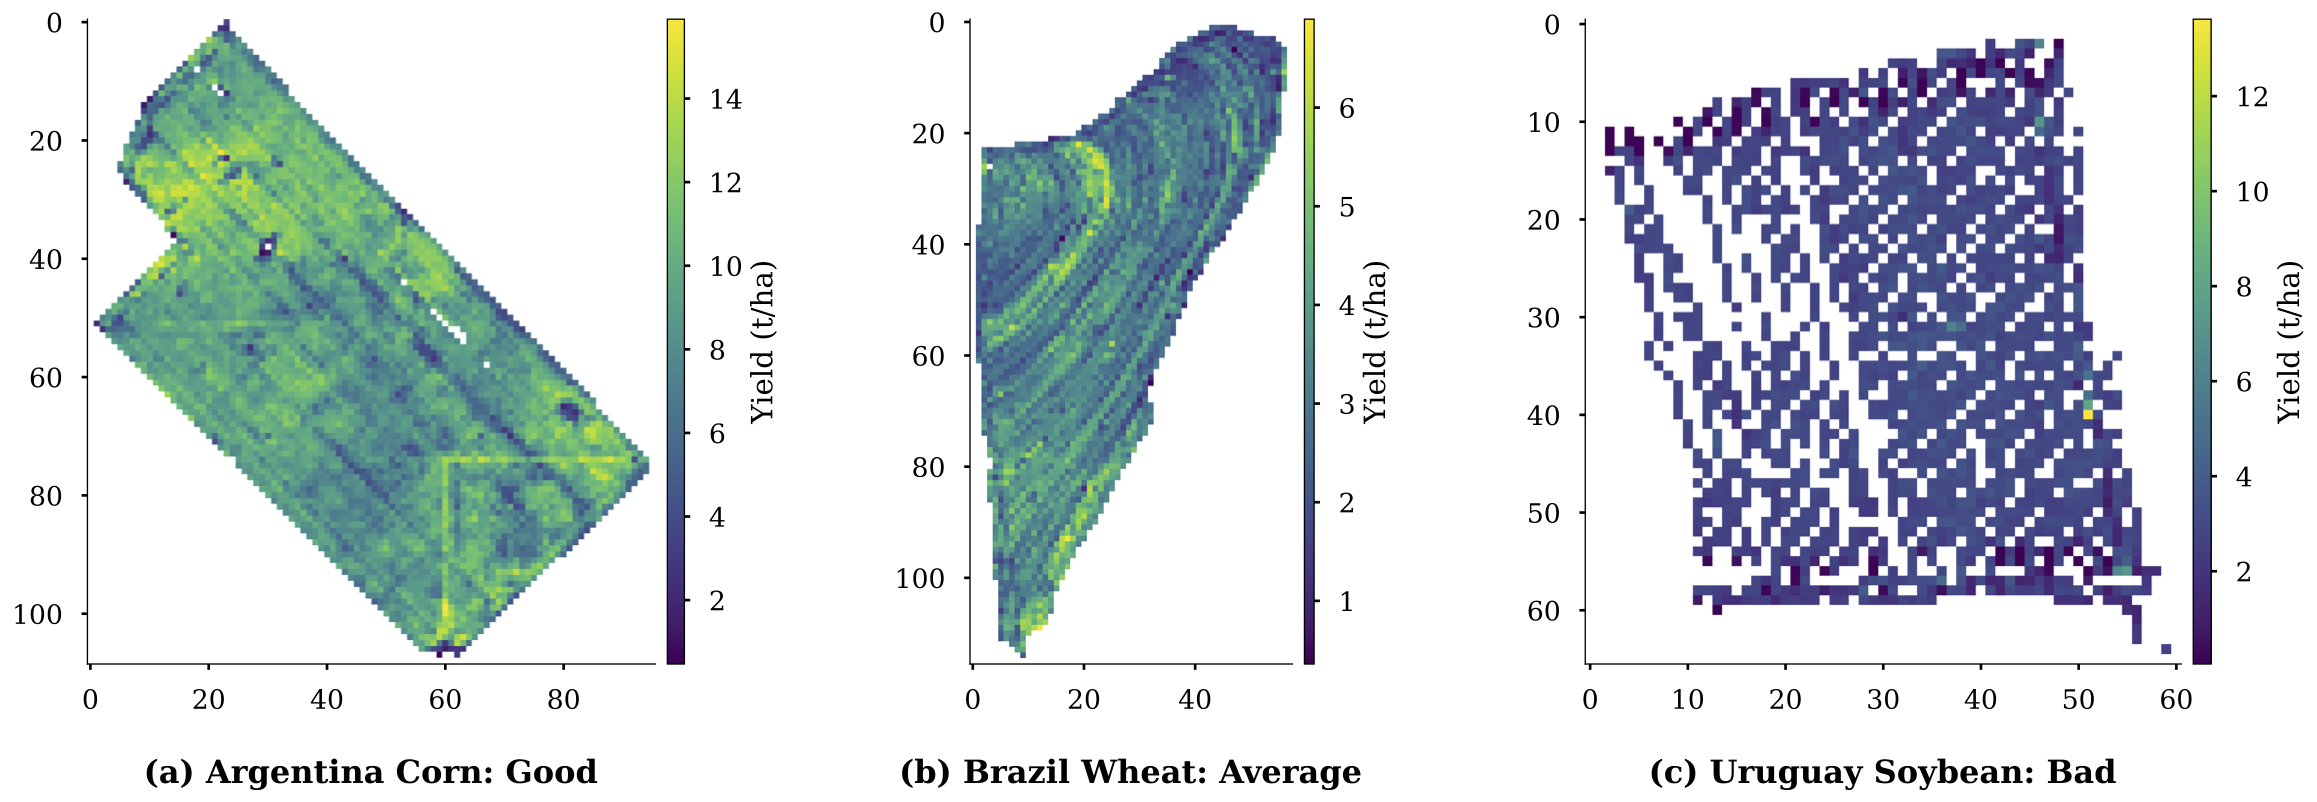
architectures. Furthermore, we highlight open challenges arising from severe distribution shifts in the ground truth data under real-world conditions. To mitigate this, we explore a domain-informed Deep Ensemble approach that exhibits significant performance gains.

Why YieldSAT?

YieldSAT addresses critical gaps in crop yield prediction research by providing the first comprehensive dataset designed for both field-level and subfield (pixel-level) yield prediction. Unlike existing datasets that are limited to single regions or crop types, YieldSAT offers unprecedented diversity and scale.

High Resolution & Large Scale

Over 12.2 million yield samples at 10m × 10m resolution across 138,288 hectares, enabling detailed subfield variability analysis.

Geographic & Temporal Diversity

Data from 4 countries across 2 continents, spanning 9 years (2016-2024), capturing diverse climate zones and agricultural practices.

Expert-Curated Quality

All 2,173 fields manually inspected by agricultural experts. Comprehensive preprocessing pipeline removes erroneous measurements while preserving data integrity.

ML-Ready Format

Available in two formats: preprocessed xarray format (24 time steps, input fusion) and flexible format with raw modalities for advanced research.

Dataset Overview

YieldSAT provides high-resolution (10m × 10m) yield data from combine harvesters paired with Sentinel-2 time series, weather, soil, and topography data. The dataset covers approximately 138,288 hectares (~1,383 km²) across major agricultural regions in Argentina, Brazil, Uruguay, and Germany.

Geographic Distribution of Fields

Geographic Distribution of Dataset

Spatial distribution of 2,173 fields across South America (left) and Europe (right). Marker colors indicate crop type, and marker size represents field area.

Fields

2,173

Countries

4

Total Area (ha)

138,288

Years

2016-2024

Crop Types

4

Yield Samples

12.2M

Satellite Images

113,555

Features

72

Crop Distribution by Country

Country Corn Rapeseed Soybean Wheat Total Fields Avg Field Size (ha) Years Covered
Argentina 185 - 440 126 751 74.3 2017-2024
Brazil 118 - 293 140 551 78.2 2017-2024
Uruguay - - 572 - 572 57.3 2018-2022
Germany - 111 - 188 299 21.6 2016-2022
Total 303 111 1,305 454 2,173 57.8 2016-2024

Note: "-" indicates crop not available in that country

Yield Distribution Diversity

Yield distributions by crop and country

Yield distributions vary significantly between crops and countries (p < 0.0001), demonstrating the dataset's diversity and the challenge of distribution shift.

Combine Harvester Yield Data

The core of YieldSAT consists of high-resolution yield measurements collected from combine harvesters equipped with GPS and yield monitoring systems. During harvest, each data point captures geographic coordinates (latitude and longitude), wet yield amount, moisture content, and timestamp. The dataset includes over 12.2 million yield samples at 10m spatial resolution. Raw point vector data is rasterized to align with Sentinel-2 imagery, enabling pixel-wise yield prediction as an image regression task.

Data Collection & Processing Pipeline

Yield Data Processing Pipeline

Schematic overview of data collection and preprocessing: combine harvester collects point vector data, which is preprocessed and rasterized to align with Sentinel-2 10m grid for pixel-wise regression.

Data Quality & Preprocessing

All yield maps are manually inspected and curated by agricultural experts. The comprehensive preprocessing pipeline ensures data quality while preserving the original measurements as much as possible:

  • Format standardization: Conversion to shapefile format and coordinate system transformation from WGS84 to UTM
  • Quality control: Manual inspection and curation by agricultural experts with quality level classification
  • Outlier removal: Removal of zero yields, biologically infeasible values (crop-specific maximum thresholds), and statistical outliers (±3σ)
  • Moisture correction: Conversion to standard dry yield using the formula: \(y_s = y_w \times \frac{1 - m_m}{1 - m_s}\), where \(y_s\) is scaled (dry) yield, \(y_w\) is wet yield, \(m_m\) is measured moisture, and \(m_s\) is standard moisture
  • Rasterization: Conversion to 10m resolution raster format aligned with Sentinel-2 grid using spatial averaging

Data Quality Levels

The dataset includes fields with varying quality levels. Examples of good, average, and bad quality yield maps are shown below to ensure transparency:

Good quality yield map

Good: Dense, consistent measurements. Average: Some spatial gaps or minor artifacts. Bad: Sparse data or significant artifacts.

Field quality labels per country

Yield map quality label per country

Yield map quality distribution per country. Yield maps were manually labeled, following a stringent guideline.

Sentinel-2 Time Series

For each field, YieldSAT provides multi-temporal Sentinel-2 Level-2A imagery spanning the entire growing season from seeding to harvest. Images are acquired at approximately 5-day intervals and include all 13 spectral bands (10m, 20m, and 60m native resolution). Low-resolution bands are upsampled to 10m using nearest-neighbor interpolation for uniform spatial resolution. The Scene Classification Layer (SCL) is included for cloud masking and quality assessment, providing 12 class labels (vegetated, non-vegetated, water, cloud, cloud shadow, etc.). In total, 113,555 labeled satellite images are provided.

Example: Soybean Field Time Series (Seeding to Harvest)

Sentinel-2 time series from seeding to harvest

Multi-temporal Sentinel-2 imagery showing crop development from seeding (left) through growing season to harvest (right). The final image shows the collected yield map. Cloud coverage is visible in some time steps.

Available Sentinel-2 Bands

Band Description Central Wavelength (nm) Native Resolution (m) Dataset Resolution (m)
B01 Coastal Aerosol 443 60 10
B02 Blue 490 10 10
B03 Green 560 10 10
B04 Red 665 10 10
B05 Red Edge 1 705 20 10
B06 Red Edge 2 740 20 10
B07 Red Edge 3 783 20 10
B08 NIR 842 10 10
B8A Narrow NIR 865 20 10
B09 Water Vapour 945 60 10
B10 SWIR Cirrus 1380 60 10
B11 SWIR 1 1610 20 10
B12 SWIR 2 2190 20 10
SCL Scene Classification - 20 10

Note: Low-resolution bands upsampled to 10m using nearest-neighbor interpolation

Auxiliary Environmental Data

To complement Sentinel-2 imagery and compensate for missing data due to cloud cover, YieldSAT includes Additional Data Modalities (ADMs) that influence crop development and yield. All data sources meet strict criteria: (1) demonstrated influence on crop growth, (2) freely accessible, (3) global coverage, and (4) high spatial resolution. These modalities provide over 70 features per sample.

Weather Data

  • Source: ERA5-Land Reanalysis (ECMWF)
  • Temporal Resolution: Daily
  • Variables: Maximum temperature, mean temperature, minimum temperature, total precipitation
  • Spatial Resolution: 30 km (interpolated to field centroids)
  • Coverage: Entire growing season (seeding to harvest)

Soil Properties

  • Source: SoilGrids 2.0
  • Variables: Soil organic carbon, nitrogen, cation exchange capacity, clay content, silt content, sand content, pH, coarse fragments
  • Depth Layers: 6 layers (0-5, 5-15, 15-30, 30-60, 60-100, 100-200 cm)
  • Spatial Resolution: 250m native, upsampled to 10m using cubic spline interpolation

Topography Data

  • Source: SRTM (Shuttle Radar Topography Mission)
  • Spatial Resolution: 30m native, upsampled to 10m using cubic spline interpolation
  • Variables: Digital Elevation Model (DEM), slope, aspect, curvature, Topographic Wetness Index (TWI)
  • Processing: Derived features computed using RichDEM library

Management Information

  • Crop Types: Corn (Zea mays), rapeseed (Brassica napus), soybean (Glycine max), wheat (Triticum aestivum)
  • Seeding Date: Reported by farmers or estimated from NDVI time series
  • Harvest Date: Extracted from combine harvester timestamp
  • Field Boundaries: Manually digitized polygons for each field

Benchmark Results

We provide comprehensive benchmark results using various deep learning architectures and data fusion methods. Models are evaluated at both subfield (pixel) and field levels under three experimental setups: 10-fold cross-validation (CV10), leave-one-region-out (LORO), and leave-one-year-out (LOYO). The table below highlights the CV10 setting, while the complete CV10, LORO, and LOYO results are available on the full results page.

Evaluated Architectures

Temporal-Only Models

  • LSTM: Long Short-Term Memory for temporal modeling without spatial context
  • Transformer: Attention-based temporal modeling with self-attention mechanism

Spatial-Temporal Models

  • 3D-LSTM: LSTM with 3D-CNN blocks for spatial-temporal modeling
  • 3D-ConvLSTM: Convolutional LSTM with built-in spatial dependencies

Simple Fusion

  • Input Fusion: Early concatenation of all modalities via spatial/temporal repetition

Advanced Fusion

  • MMGF: Multi-modal gated fusion with learnable gating mechanisms
  • AFF: Attention-based feature fusion with learnable query for channel attention

Results

These tables report CV10 results only, where CV10 refers to 10-fold cross-validation. On smaller screens, scroll horizontally to inspect each table.

Field-Level

Modalities Fusion Method Model ARG-S BRA-C GER-R GER-W URG-S
R2 RMSE R2 RMSE R2 RMSE R2 RMSE R2 RMSE
Sentinel-2 X Transformer[1] 0.73 0.63 0.79 0.82 0.75 0.67 0.56 1.26 0.72 0.56
LSTM[5] 0.72 0.64 0.75 0.88 0.62 0.83 -0.87 2.60 0.66 0.62
3D-ConvLSTM[2] 0.79 0.55 0.82 0.74 0.81 0.58 0.65 1.12 0.77 0.51
3D-LSTM[4] 0.77 0.58 0.82 0.74 0.82 0.57 0.54 1.28 0.73 0.56
Sentinel-2 + ADM Input Fusion Transformer[1] 0.72 0.64 0.79 0.81 0.76 0.65 0.61 1.19 0.73 0.55
LSTM[5] 0.72 0.64 0.81 0.78 0.81 0.58 0.63 1.16 0.72 0.56
3D-ConvLSTM[2] 0.82 0.52 0.83 0.72 0.78 0.63 0.70 1.03 0.80 0.48
3D-LSTM[4] 0.76 0.59 0.84 0.71 0.81 0.59 0.62 1.17 0.77 0.52
Feature Fusion AFF[4] 0.84 0.49 0.84 0.70 0.80 0.60 0.74 0.96 0.82 0.46
MMGF[3] 0.82 0.51 0.76 0.86 0.75 0.68 0.77 0.90 0.75 0.53

Subfield (Pixel)-Level

Modalities Fusion Method Model ARG-S BRA-C GER-R GER-W URG-S
R2 RMSE R2 RMSE R2 RMSE R2 RMSE R2 RMSE
Sentinel-2 X Transformer[1] 0.62 0.94 0.44 2.16 0.44 1.25 0.32 2.43 0.38 1.24
LSTM[5] 0.60 0.96 0.42 2.20 0.36 1.33 -0.32 3.38 0.37 1.26
3D-ConvLSTM[2] 0.65 0.90 0.45 2.13 0.49 1.20 0.34 2.40 0.41 1.22
3D-LSTM[4] 0.65 0.90 0.46 2.13 0.48 1.20 0.30 2.46 0.39 1.23
Sentinel-2 + ADM Input Fusion Transformer[1] 0.58 0.98 0.44 2.17 0.45 1.24 0.38 2.32 0.39 1.23
LSTM[5] 0.59 0.98 0.43 2.18 0.47 1.21 0.35 2.38 0.39 1.23
3D-ConvLSTM[2] 0.68 0.87 0.46 2.12 0.42 1.27 0.39 2.30 0.42 1.20
3D-LSTM[4] 0.64 0.91 0.46 2.12 0.49 1.20 0.37 2.34 0.40 1.22
Feature Fusion AFF[4] 0.73 0.79 0.46 2.12 0.49 1.20 0.44 2.20 0.43 1.19
MMGF[3] 0.70 0.84 0.42 2.19 0.44 1.26 0.44 2.21 0.40 1.22

ARG-S: Argentina Soybean, BRA-C: Brazil Corn, GER-R: Germany Rapeseed, GER-W: Germany Wheat, URG-S: Uruguay Soybean. Blank or X indicates no fusion method is used for Sentinel-2-only models in the corresponding setup. This table reports CV10 only, where CV10 refers to 10-fold cross-validation. Superscript references next to model names link to the benchmark papers listed below.

Key Findings

  • Spatial modeling matters: Models with 3D-CNN blocks (3D-LSTM, 3D-ConvLSTM) generally outperform temporal-only baselines, underscoring the value of spatial context
  • Advanced fusion is beneficial: Feature-fusion models remain competitive under standard CV10 evaluation, but robustness under LORO and LOYO remains a substantial challenge
  • Field-level vs pixel-level: Field-level predictions generally achieve stronger scores than pixel-level predictions, as spatial aggregation reduces local noise
  • Dataset variability: Performance varies strongly across countries, crops, and experimental setups, highlighting pronounced distribution shifts
  • ADM benefits depend on architecture: Auxiliary modalities can help, but their effect depends on the fusion scheme and evaluation regime

Qualitative Results

Example prediction showing ground truth, prediction, and error maps

Qualitative results for a single soybean field from Argentina. Top left to bottom right: ground truth yield map, predicted yield map, prediction over target plot, input distribution over time, clipped relative pixel-wise error (100%), relative pixel-wise error (full range), histogram of predicted (blue) and target (green) values. The predictions are generated with the 3D-LSTM model.

Open Challenges: Distribution Shift

A critical challenge in crop yield prediction is severe distribution shift across years and regions due to climate variability, management practices, and environmental conditions. The YieldSAT dataset exhibits significant statistical differences in yield distributions between years and regions (p < 0.0001), making it an ideal testbed for studying model robustness under real-world distribution shift.

Impact on Model Performance

We evaluate models under two realistic scenarios that reflect deployment conditions:

  • Leave-One-Year-Out (LOYO): Training on multiple years and predicting the next harvest (temporal shift)
  • Leave-One-Region-Out (LORO): Training on fields from some farmers/regions and predicting yields in new regions (spatial shift)

Standard models exhibit severe performance degradation under distribution shift:

Performance Drop (LOYO)

-19 p.p.

R² reduction compared to standard CV

Performance Drop (LORO)

-22 p.p.

R² reduction compared to standard CV

Surface Reflectance Diversity

t-SNE visualization of surface reflectance

t-SNE visualization of Sentinel-2 surface reflectance patterns. Left: colored by country. Right: colored by crop type. Clear separation demonstrates significant diversity in input data distributions, contributing to the distribution shift challenge.

Future Research Directions

YieldSAT enables research on several important open challenges:

  • Robust models: Developing architectures that maintain performance under distribution shift
  • Domain adaptation: Transfer learning methods to adapt models from one region/year to another
  • Foundation models: Pre-training on large-scale Earth observation data for improved generalization
  • Uncertainty quantification: Reliable confidence estimates for predictions under shift
  • Physics-informed approaches: Incorporating crop growth models and physical constraints
  • Explainability: Understanding what models learn and why they fail under distribution shift

BibTeX

@inproceedings{miranda_2026_yieldsat,
  title={YieldSAT: A Multimodal Benchmark Dataset for High-Resolution Crop Yield Prediction},
  author = {Miranda, Miro and Pathak, Deepak and Helber, Patrick and Bischke, Benjamin and Najjar, Hiba and Mena, Francisco and Sanchez, Cristhian and Pai, Akshay and Arenas, Diego and Toro, Matias Valdenegro and Charfualan, Marcela and Nuske, Marlon and Dengel, Andreas},
  booktitle={Proceedings of the Computer Vision and Pattern Recognition Conference (CVPR)},
  year={2026}
}

Benchmark References

[1] P. Helber et al., “Crop yield prediction: An operational approach to crop yield modeling on field and subfield level with machine learning models,” in IGARSS - IEEE international geoscience and remote sensing symposium, IEEE, 2023, pp. 2763–2766.

[2] P. Helber, B. Bischke, C. Packbier, P. Habelitz, and F. Seefeldt, “An operational approach to large-scale crop yield prediction with spatio-temporal machine learning models,” in IGARSS 2024-2024 IEEE international geoscience and remote sensing symposium, IEEE, 2024, pp. 4299–4302.

[3] F. Mena et al., “Adaptive fusion of multi-modal remote sensing data for optimal sub-field crop yield prediction,” Remote Sensing of Environment, vol. 318, p. 114547, 2025.

[4] M. Miranda, D. Pathak, M. Nuske, and A. Dengel, “Multi-modal fusion methods with local neighborhood information for crop yield prediction at field and subfield levels,” in IGARSS 2024-2024 IEEE international geoscience and remote sensing symposium, IEEE, 2024, pp. 4307–4311.

[5] D. Pathak et al., “Predicting crop yield with machine learning: An extensive analysis of input modalities and models on a field and sub-field level,” in IGARSS- IEEE international geoscience and remote sensing symposium, 2023, pp. 2767–2770. doi: 10.1109/IGARSS52108.2023.10282318.

Website template adapted from Nerfies.